About Interactive Stock Charts
Annoucement: v2.81 includes new data source for AlphaVantage for international market data. New!! Candlestick Pattern Scanner and Indicator Reliability Lab added to allow Instant backtesting! Interactive Stock Charts (c)...
Annoucement: v2.81 includes new data source for AlphaVantage for international market data.
New!! Candlestick Pattern Scanner and Indicator Reliability Lab added to allow Instant backtesting!
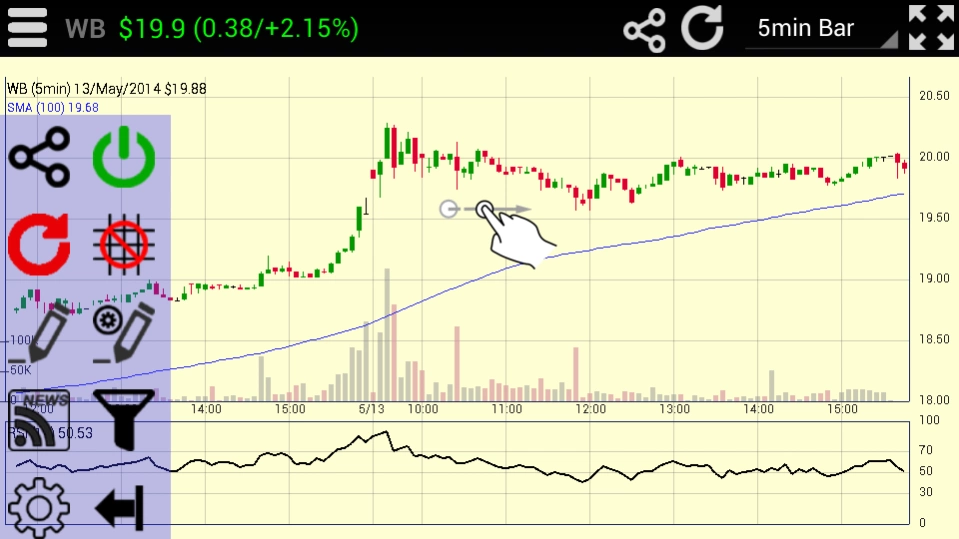
Interactive Stock Charts © is the most intuitive and advanced stock analysis charting app. You can freely adjust time frame and view technical information with touch of finger: scroll, pan and zoom on a beautiful candlestick charts with gesture and touch control. Swipe to scroll into historical analysis, pinch to zoom and change time frame, touch on price points to show detailed quotes and technical indicator values. You can also place real trade orders directly from the charts and portfolio view, through our partner Tradier Brokerage for US equity and options. Backed by Screenulator's patent pending automated chart pattern and trendline recognition engine, and industry's first 9,13 indicator completion screener! Interactive Stock Charts also comes with a powerful technical analysis tool set, Indicator Reliability Lab - in-chart backtesting tool and realtime RSS news feed to give you an edge over the market!
Using AI-based Deep Learning Neural Networks algorithms, Screenulator detects highly proftable chart patterns and reliable trendlines, TR/TD Indicators signals, as well as candlestick patterns. Backtested with 50+ years of historical big data, it ensures the you always have an edge against increasingly unpredictable markets! All Screenulator chart patterns are available on www.screenulator.com website for existing subscribers, see website for more member benefits.
Recent Additions:
Candlestick Pattern Scanner: http://www.screenulator.com/show_video.php?id=-XCcw46omgs
Indicator Reliability Lab:
About Trendlines:
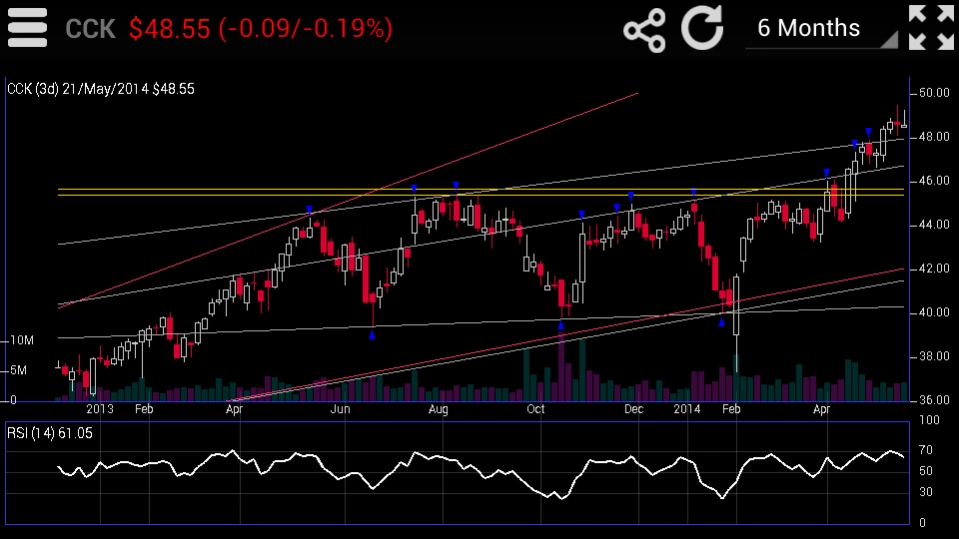
A trend line is a bounding line for the price movement of a security. A support trend line (or a bottom line) is formed when a securities price decreases and then rebounds at a pivot point that aligns with at least two previous support pivot points. Trendlines are considered by many expert traders to be the single most important tools in technical analysis. However, Support and Resistance breakout and Triangle patterns are just example of patterns formed by trendlines. This app automatically draws and screens for stocks with specific patterns.To learn more: http://www.screenulator.com/cgi-bin/v?pid=ref#trendlines
About Trend Reversal Indicator:
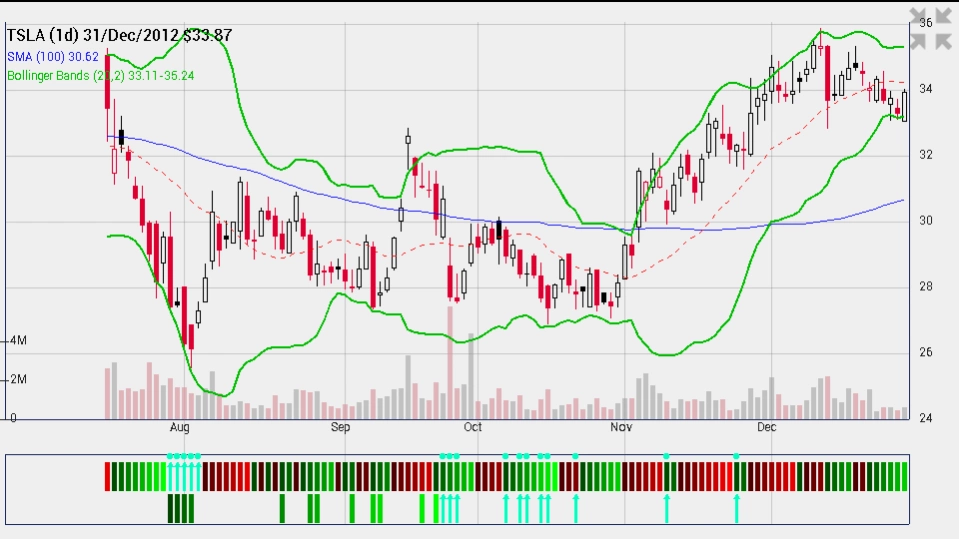
Screenulator's patent pending Trend Reversal and Exhaustion indicators combines 9,13 counting with trendline analysis to pinpoint trend pivots with color coded visual indicator. It has been shown to have an impressive record of identifying and anticipating turning points across the FX, bond, equity and commodity markets. Furthermore, the indicators provide signals not only on a daily chart but also intraday. It identifies when a trend is becoming, or has become, exhausted. This apps automatically identifies Trend Reversal, Trend Exhaustion, and Perfection criteria. It also calculates stoploss levels. To learn more: http://www.screenulator.com/show_video.php?id=TR_EXAMPLES
http://www.screenulator.com/cgi-bin/v?pid=ref#reversal
Classic TA indicators and overlays: RSI, MACD, SMA, EMA, Bollinger, Keltner band, Donchian Channel, Parabolic SAR, Ichimoku Cloud, McGinley Dynamic, SuperTrend, stochastic, ADX, Aroon, Chaikin, Ultimate, MFI, OBV, ATR, ADL, CCI indicators. Fibonacci Retracement and text annotation tools. Others will available upon requests.
Note: This app is free trial for 2 weeks or 100 usages whichever comes first.
Instruction Manual: http://www.screenulator.com/ischarts_faq.html
Desktop version: http://www.screenulator.com/ischarts_desktop.html
Previous Versions
Here you can find the changelog of Interactive Stock Charts since it was posted on our website on 2016-12-28 01:17:34.
The latest version is 2.86 and it was updated on 2024-04-22 10:58:14. See below the changes in each version.
Interactive Stock Charts version 2.86
Updated At: 2020-09-19
Changes: Bug fixes and symbols update
Interactive Stock Charts version 2.85
Updated At: 2020-07-07
Changes: Bug fix
Interactive Stock Charts version 2.84
Updated At: 2020-05-26
Changes: Stock market data set update, default portfolio update. Realtime intraday chart streaming.
Interactive Stock Charts version 2.82
Updated At: 2019-05-21
Changes: Fix US Intraday Data
Interactive Stock Charts version 2.73
Updated At: 2018-01-18
Changes: Fix TSXV charts.
Interactive Stock Charts version 2.48
Updated At: 2016-08-28
Changes: Indicator MA overlays,Bollinger Bandwidth Indicator,Candlestick Pattern Scanner,Indicator Reliability Lab,IRL update
Disclaimer
Official Google Play Link
We do not host Interactive Stock Charts on our servers. We did not scan it for viruses, adware, spyware or other type of malware. This app is hosted by Google and passed their terms and conditions to be listed there. We recommend caution when installing it.
The Google Play link for Interactive Stock Charts is provided to you by apps112.com without any warranties, representations or guarantees of any kind, so access it at your own risk.
If you have questions regarding this particular app contact the publisher directly. For questions about the functionalities of apps112.com contact us.